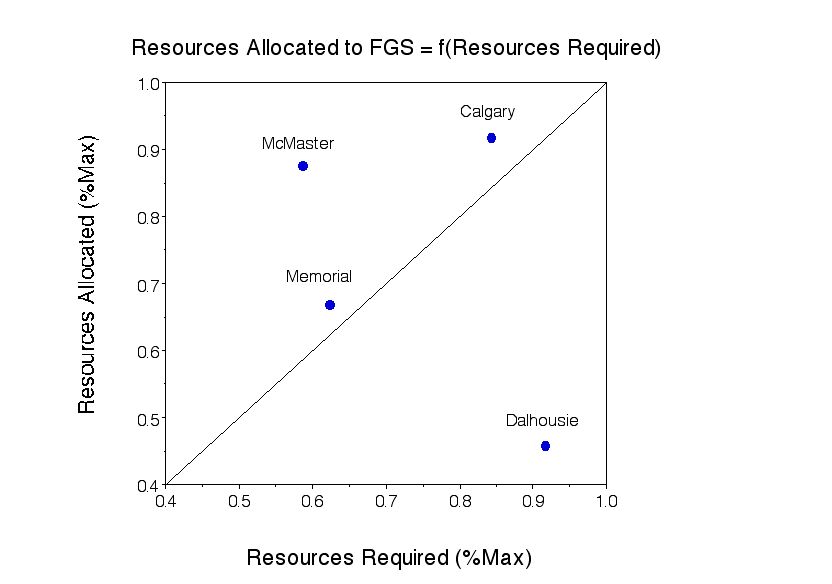
| The data from the previous page are illustrated below in one simple figure wherein the two "demand" variables are combined (after conversion to proportions of the maximum) and plotted on the abcissa and the two "supply" variables are similarly combined and plotted on the ordinate. Relative to these three comparator universities, our FGS is seriously under-resourced. |